


Lockie
-
Posts
4 -
Joined
-
Last visited
Everything posted by Lockie
-
Hi I am trying to create a graph that begins at zero at a zero time stamp. However when I change the graph x expression (in graph properties) from "time" to anything referencing "systime()" the trace disappears. My approach was to use the start time from a button that runs the below code: global expStartTime1 = systime() // Test Phase Timer global expStopTime1 = 0 global GraphTime = Time() and create a graph using the x expression "systime()-expStartTime1" (with bottom axis set to time and date). I have tried heaps of things but it appears that when systime() is used I lose the data? Any help would be really appreciated.
-
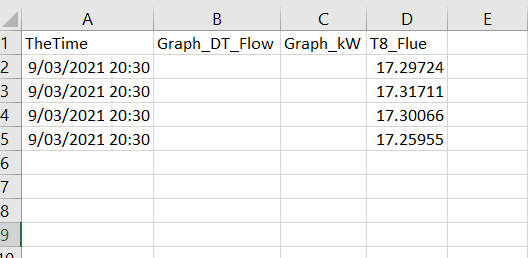
Hi I am struggling to log (and graph) a number of global variables that have been calculated in sequences. Have got the graphing working but it wont log the data for me. I have logging set up for raw data from inputs and am wanting to log the global variables for a few hours at a time so from what I can see logging may be better suited than export sets. I have created a test channel for each variable I want to log (and graph) as below: I then have a sequence running to make the variable a string in the channel While (1) Graph_DT_Flow.AddValue(insertTime(DT_Flow,systime(),0)) Graph_kW.AddValue(insertTime(kW,systime(),0)) delay(1) endwhile This allows me to graph the channels which is working but when I try to log them the column when opened in excel only has the heading. If you could help with this it would be amazing!!


-

Hour, minute, second timer
Lockie replied to Lockie's topic in Channels, Conversions and general data acquisition
Legend! that's bang on. + Good work on DAQ Factory... Great product FYI - For reference for anyone in the forum looking to do a similar thing - Have added some bits to name the data logging file + added an extra timer to display total test time: In a button quick sequence: // Starts Timer and starts Data logging if (Timer2Running != 1) global expStartTime2 = systime() // Total Test Timer global expStopTime2 = 0 global Timer2Running = 1 endif global expStartTime1 = systime() // Test Phase Timer global expStopTime1 = 0 if (logging.Data1.running) endlogging(Data1) delay(1) logging.Data1.strFileName = "file path" + formatdatetime("%y_%m_%d@%H_%M",systime()) + ".csv" //add folder address into file path where ya want it saved. beginlogging(Data1) else logging.Data1.strFileName = "C:\Users\rs\Desktop\Calirometer Room\Test Data\CM1_" + formatdatetime("%y_%m_%d@%H_%M",systime()) + ".csv" beginlogging(Data1) endif Stop timer button quick sequence: //Stops Timer & Data Logging Data1 expStopTime1 = systime() endLogging(Data1) Second stop timer button quick sequence: //Stops Timer & Data Logging Data1 expStopTime2 = systime() endLogging(Data1) Timer2Running = 0 // resets bit to allowed timer to be started
-
Hi, I am new to Daqfactory and fairly new to labjack (T7) which is being used. I am struggling to set up a visual timer that can be started and stopped with a button and will visually display time lapsed time in hours, minutes and seconds. Ultimately I also want data logging to be stopped and started at the same time. Any guidance or examples on how this is best achieved would be amazing! Thanks


