


Lockie
-
Posts
4 -
Joined
-
Last visited
Posts posted by Lockie
-
-
Hi
I am struggling to log (and graph) a number of global variables that have been calculated in sequences. Have got the graphing working but it wont log the data for me. I have logging set up for raw data from inputs and am wanting to log the global variables for a few hours at a time so from what I can see logging may be better suited than export sets.
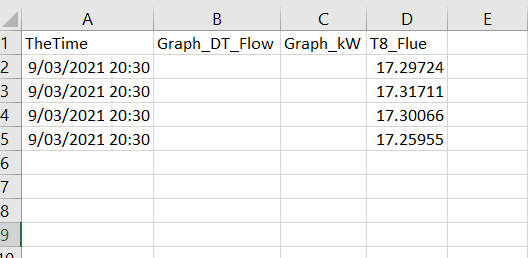
I have created a test channel for each variable I want to log (and graph) as below:

I then have a sequence running to make the variable a string in the channel
While (1)
Graph_DT_Flow.AddValue(insertTime(DT_Flow,systime(),0))
Graph_kW.AddValue(insertTime(kW,systime(),0))
delay(1)
endwhileThis allows me to graph the channels which is working but when I try to log them the column when opened in excel only has the heading.

If you could help with this it would be amazing!!

-
Legend! that's bang on.
+ Good work on DAQ Factory... Great product
")
FYI - For reference for anyone in the forum looking to do a similar thing - Have added some bits to name the data logging file + added an extra timer to display total test time:

In a button quick sequence:
// Starts Timer and starts Data logging
if (Timer2Running != 1)
global expStartTime2 = systime() // Total Test Timer
global expStopTime2 = 0
global Timer2Running = 1
endifglobal expStartTime1 = systime() // Test Phase Timer
global expStopTime1 = 0if (logging.Data1.running)
endlogging(Data1)
delay(1)
logging.Data1.strFileName = "file path" + formatdatetime("%y_%m_%d@%H_%M",systime()) + ".csv" //add folder address into file path where ya want it saved.
beginlogging(Data1)else
logging.Data1.strFileName = "C:\Users\rs\Desktop\Calirometer Room\Test Data\CM1_" + formatdatetime("%y_%m_%d@%H_%M",systime()) + ".csv"
beginlogging(Data1)
endifStop timer button quick sequence:
//Stops Timer & Data Logging Data1
expStopTime1 = systime()
endLogging(Data1)Second stop timer button quick sequence:
//Stops Timer & Data Logging Data1
expStopTime2 = systime()
endLogging(Data1)Timer2Running = 0 // resets bit to allowed timer to be started
-
Hi,
I am new to Daqfactory and fairly new to labjack (T7) which is being used. I am struggling to set up a visual timer that can be started and stopped with a button and will visually display time lapsed time in hours, minutes and seconds. Ultimately I also want data logging to be stopped and started at the same time.
Any guidance or examples on how this is best achieved would be amazing!
Thanks


graphing against systime()
in Graphing
Posted
Hi
I am trying to create a graph that begins at zero at a zero time stamp. However when I change the graph x expression (in graph properties) from "time" to anything referencing "systime()" the trace disappears.
My approach was to use the start time from a button that runs the below code:
global expStartTime1 = systime() // Test Phase Timer
global expStopTime1 = 0
global GraphTime = Time()
and create a graph using the x expression "systime()-expStartTime1" (with bottom axis set to time and date). I have tried heaps of things but it appears that when systime() is used I lose the data?
Any help would be really appreciated.